在您使用 PyTorch 在 GPU 上的时间中,您可能已经熟悉了这条常见的错误信息:
torch.cuda.OutOfMemoryError: CUDA out of memory. Tried to allocate 512.00 MiB. GPU 0 has a total capacity of 79.32 GiB of which 401.56 MiB is free.
在本系列中,我们展示了如何使用内存工具,包括内存快照、内存分析器和引用循环检测器来调试内存不足错误并提高内存使用率。
内存快照工具提供了对调试 GPU 内存不足的精细 GPU 内存可视化。捕获的内存快照将显示内存事件,包括分配、释放和内存不足,以及它们的堆栈跟踪。
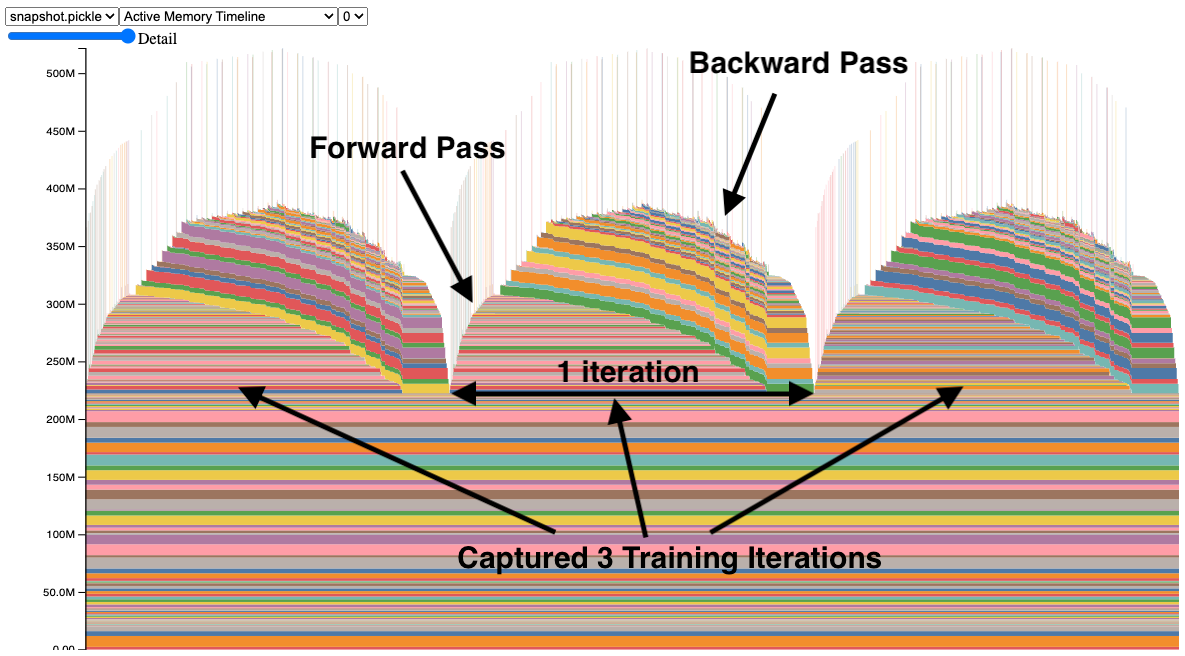
在快照中,每个张量的内存分配都分别用颜色编码。x 轴是时间,y 轴是 GPU 内存的 MB 数。该快照是交互式的,因此我们可以通过鼠标悬停来观察任何分配的堆栈跟踪。您可以在 https://github.com/pytorch/pytorch.github.io/blob/site/assets/images/understanding-gpu-memory-1/snapshot.html 尝试它。
在这个快照中,有 3 个峰值显示了 3 次训练迭代中的内存分配(这是可配置的)。观察峰值时,很容易看到正向传播期间内存的增加和反向传播期间(计算梯度时)的下降。还可以看到程序在迭代之间具有相同的内存使用模式。一个引人注目的是内存中有许多微小的峰值,通过鼠标悬停,我们可以看到它们是卷积运算符临时使用的缓冲区。
捕获内存快照
捕获内存快照的 API 相当简单,可在 torch.cuda.memory 中找到:
- 开始:
torch.cuda.memory._record_memory_history(max_entries=100000) - 保存:
torch.cuda.memory._dump_snapshot(file_name) - 停止:
torch.cuda.memory._record_memory_history(enabled=None)
代码片段(完整代码示例见附录 A):
   # Start recording memory snapshot history, initialized with a buffer
   # capacity of 100,000 memory events, via the `max_entries` field.
   torch.cuda.memory._record_memory_history(
       max_entries=MAX_NUM_OF_MEM_EVENTS_PER_SNAPSHOT
   )

   # Run your PyTorch Model.
   # At any point in time, save a snapshot to file for later.
   for _ in range(5):
       pred = model(inputs)
       loss_fn(pred, labels).backward()
       optimizer.step()
       optimizer.zero_grad(set_to_none=True)

   # In this sample, we save the snapshot after running 5 iterations.
   #   - Save as many snapshots as you'd like.
   #   - Snapshots will save last `max_entries` number of memory events
   #     (100,000 in this example).
   try:
       torch.cuda.memory._dump_snapshot(f"{file_prefix}.pickle")
   except Exception as e:
       logger.error(f"Failed to capture memory snapshot {e}")

   # Stop recording memory snapshot history.
   torch.cuda.memory._record_memory_history(enabled=None)
为了可视化快照文件,我们有一个托管在 https://maskerprc.github.io/memory_viz 的工具。在那里,您可以拖放您的保存的快照文件,它将按时间绘制每个分配。隐私提示:该工具不会保存您的快照。
或者,您可以使用 pytorch/torch/cuda/_memory_viz.py 脚本将 .pickle 文件生成 HTML,以下是一个示例:
python torch/cuda/_memory_viz.py trace_plot snapshot.pickle -o snapshot.html
调试 CUDA OOMs
让我们看看我们如何使用内存快照工具来回答:
- 为什么会发生 CUDA OOM?
- GPU 内存在哪里被使用?
ResNet50 存在 bug
我们已经查看了一个在第一张快照中正常工作的模型。现在,让我们看看一个有 bug 的训练示例,请看快照:
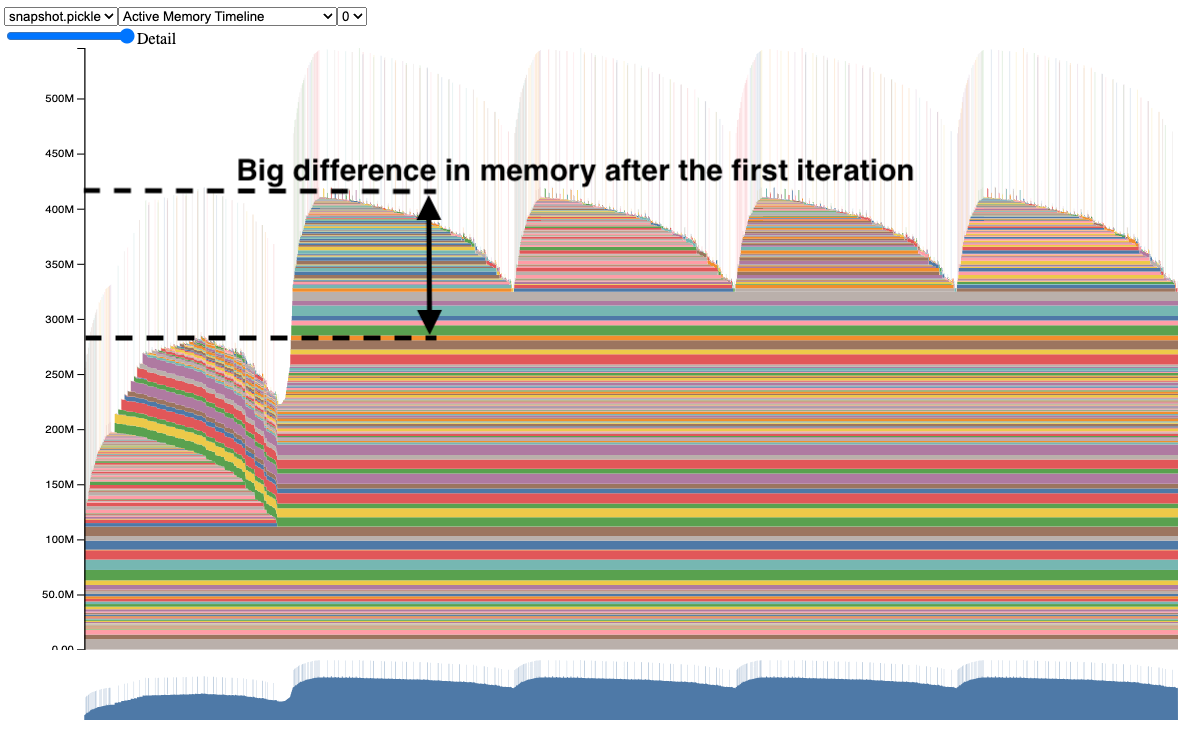
注意第二个迭代使用的内存远比第一个迭代多。如果这个模型更大,第二个迭代可能会因为 CUDA 内存不足而崩溃,而无需深入了解原因。
进一步检查这个快照,我们可以清楚地看到,从第一个迭代到第二个迭代以及之后的迭代,有几个张量一直处于活跃状态。如果我们鼠标悬停在这些张量之一上,它会显示一个堆栈跟踪,表明这些是梯度张量。
事实上,如果我们查看代码,我们可以看到它没有在正向传播之前清除梯度张量。
之前:
        for _ in range(num_iters):
          pred = model(inputs)
          loss_fn(pred, labels).backward()
          optimizer.step()
After:
        for _ in range(num_iters):
          pred = model(inputs)
          loss_fn(pred, labels).backward()
          optimizer.step()
          # Add this line to clear grad tensors
          optimizer.zero_grad(set_to_none=True)
我们可以简单地添加一个 optimizer.zero_grad(set_to_none=True) 指令来清除梯度张量,以便在每次迭代之间(更多关于为什么需要将梯度置零的详细信息请参阅:https://maskerprc.github.io/tutorials/recipes/recipes/zeroing_out_gradients.html)。
这是我们在这个工具使用更复杂的程序中发现的 bug 的简化。我们鼓励您尝试在您的 GPU 内存问题上使用内存快照,并告诉我们结果如何。
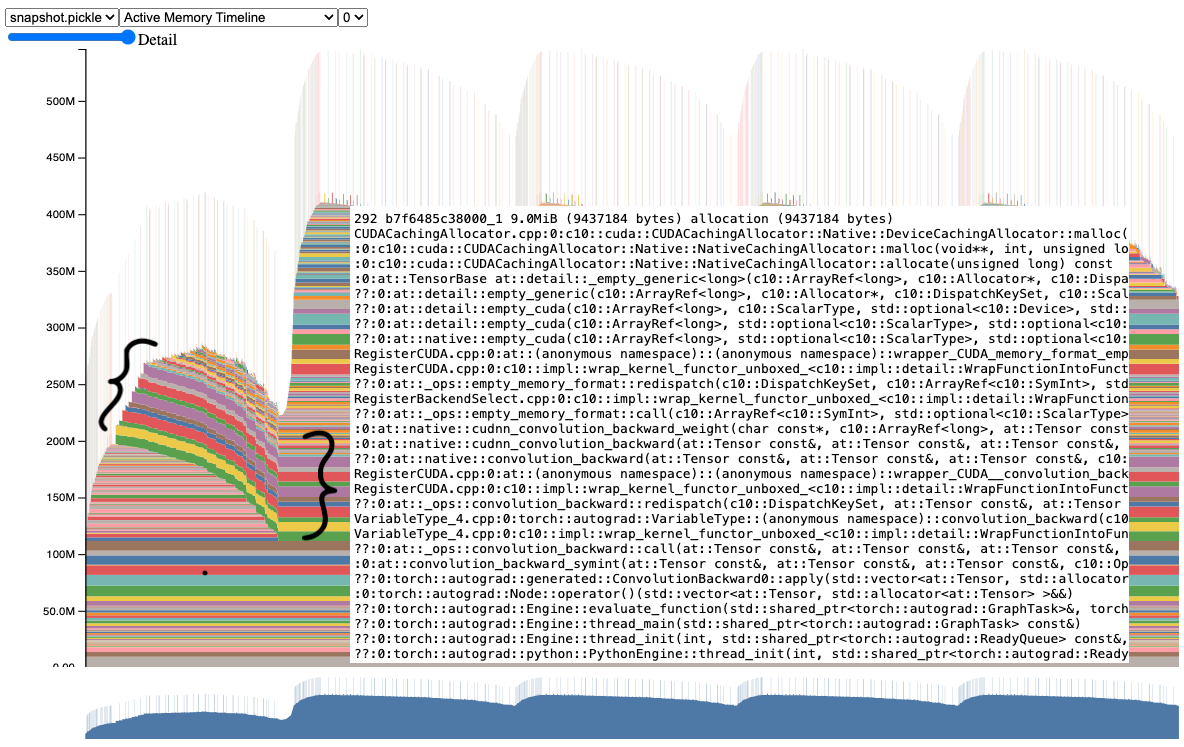
修复 bug 后的 ResNet50
应用修复后,快照现在似乎正在清除梯度。
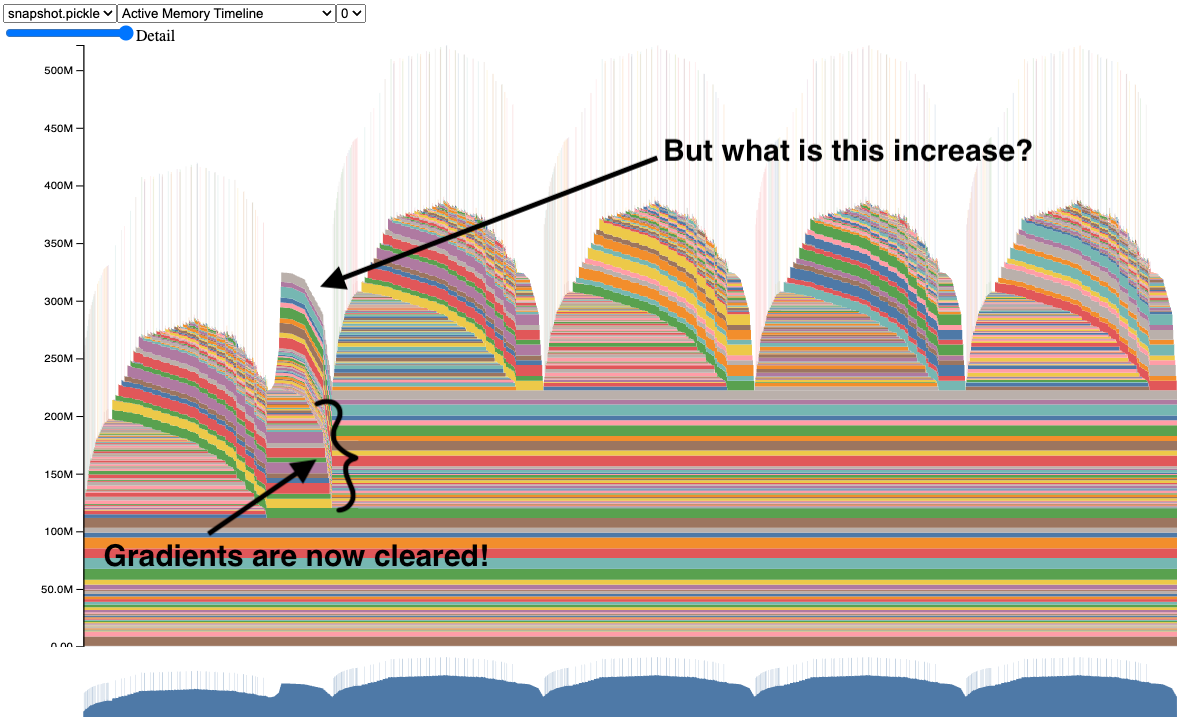
现在我们有了正常工作的 ResNet50 模型的快照。试试看代码吧(见附录 A 中的代码示例)。
但你可能想知道,为什么在第一次迭代后内存仍然会增加?为了回答这个问题,让我们在下一节中访问内存分析器。
分类内存使用
内存分析器是 PyTorch 分析器的一个附加功能,它按时间分类内存使用情况。我们仍然依赖内存快照来获取内存分配的堆栈跟踪,以便进行深入分析。
要生成内存时间线,请参考以下代码片段(完整代码示例见附录 B):
   # Initialize the profiler context with record_shapes, profile_memory,
   # and with_stack set to True.
   with torch.profiler.profile(
       activities=[
           torch.profiler.ProfilerActivity.CPU,
           torch.profiler.ProfilerActivity.CUDA,
       ],
       schedule=torch.profiler.schedule(wait=0, warmup=0, active=6, repeat=1),
       record_shapes=True,
       profile_memory=True,
       with_stack=True,
       on_trace_ready=trace_handler,
   ) as prof:
       # Run the PyTorch Model inside the profile context.
       for _ in range(5):
           prof.step()
           with record_function("## forward ##"):
               pred = model(inputs)

           with record_function("## backward ##"):
               loss_fn(pred, labels).backward()

           with record_function("## optimizer ##"):
               optimizer.step()
               optimizer.zero_grad(set_to_none=True)

   # Construct the memory timeline HTML plot.
   prof.export_memory_timeline(f"{file_prefix}.html", device="cuda:0")
更多信息请参阅 https://maskerprc.github.io/docs/main/profiler.html。
内存分析器会根据分析期间记录的张量操作图自动生成类别。
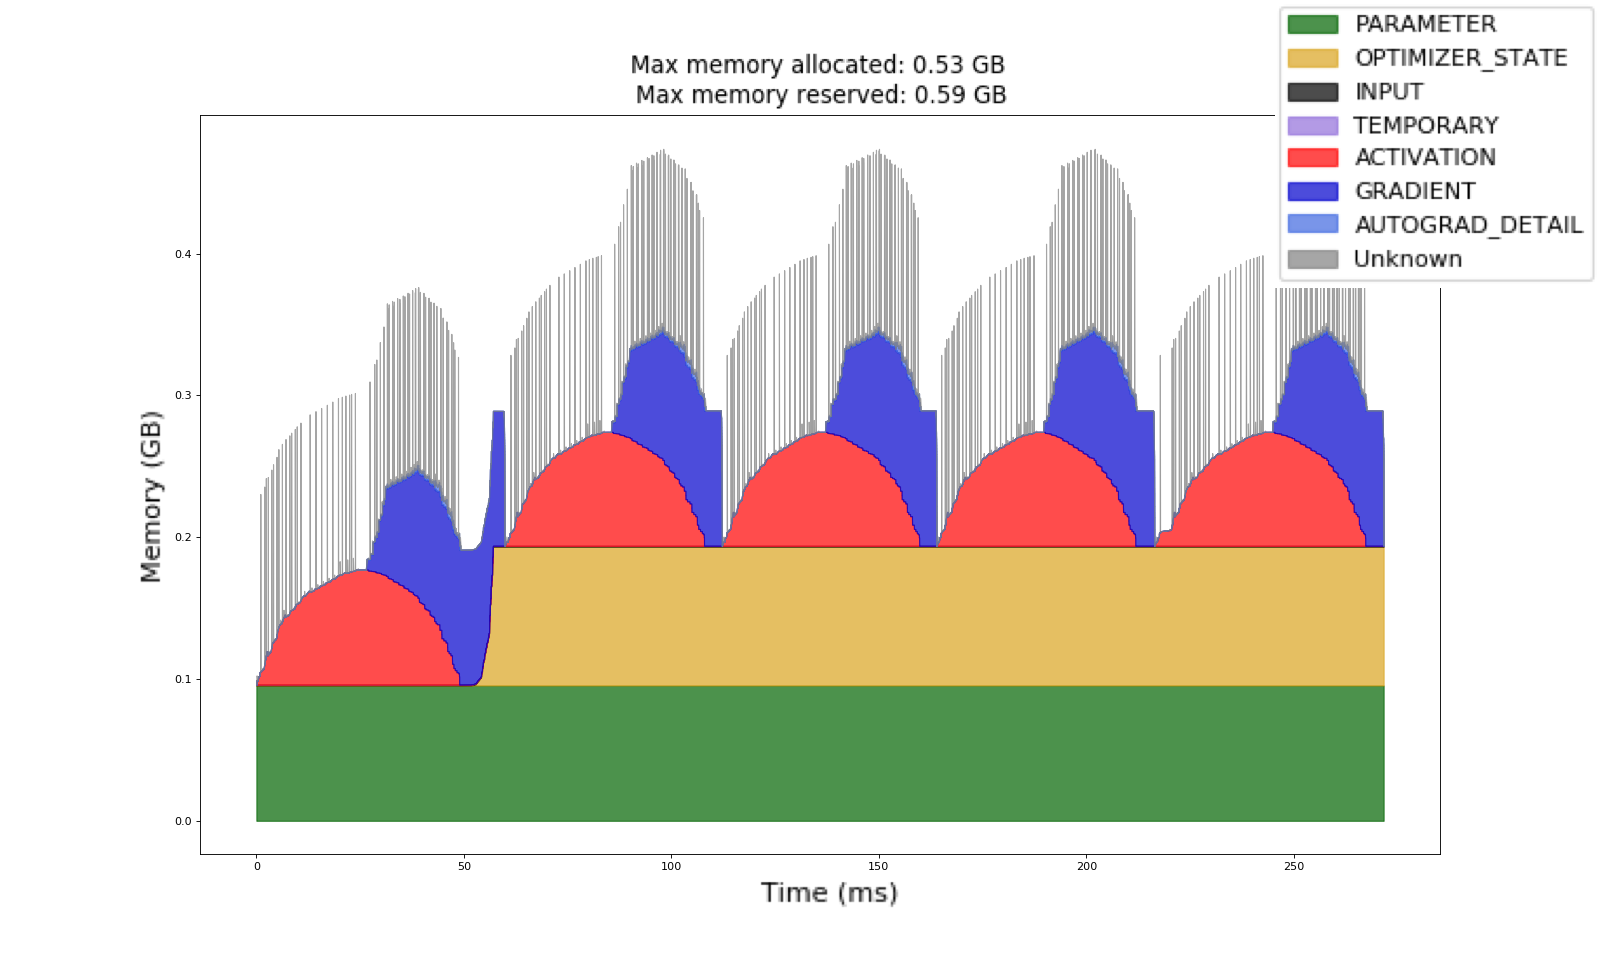
在使用内存分析器收集的此内存时间线中,我们看到了之前相同的训练示例。我们可以观察到蓝色梯度现在在迭代之间被清除。我们还可以注意到黄色优化器状态在第一次迭代后分配,并在整个作业中保持不变。
这个优化器状态是导致 GPU 内存从第一次迭代到第二次迭代增加的原因。请亲自尝试代码(见附录 B 中的代码示例)。内存分析器有助于提高对训练内存的理解,以便模型作者可以找出哪些类别使用了最多的 GPU 内存。
我在哪里可以找到这些工具?
我们希望这些工具将大大提高您调试 CUDA OOM 的能力,并按类别理解您的内存使用情况。
PyTorch v2.1 版本中提供了内存快照和内存分析器作为实验性功能。
- 更多关于内存快照的信息可以在 PyTorch 内存文档中找到。
- 更多关于内存分析器的详细信息可以在 PyTorch 分析器文档中找到。
反馈
我们期待听到您关于任何增强、错误或我们的工具帮助解决的内存故事的反馈!一如既往,请随时在 PyTorch 的 GitHub 页面上提交新问题。
我们也欢迎开源社区的贡献,请随意在 Github PR 中标记 Aaron Shi 和 Zachary DeVito 进行审查。
致谢
非常感谢内容审查员 Mark Saroufim 和 Gregory Chanan 对这篇帖子的审查,提高了其可读性。
非常感谢 Adnan Aziz 和 Lei Tian 的代码审查和反馈。
附录
附录 A - ResNet50 内存快照代码示例
# (c) Meta Platforms, Inc. and affiliates.
import logging
import socket
from datetime import datetime, timedelta

import torch

from torchvision import models

logging.basicConfig(
   format="%(levelname)s:%(asctime)s %(message)s",
   level=logging.INFO,
   datefmt="%Y-%m-%d %H:%M:%S",
)
logger: logging.Logger = logging.getLogger(__name__)
logger.setLevel(level=logging.INFO)

TIME_FORMAT_STR: str = "%b_%d_%H_%M_%S"

# Keep a max of 100,000 alloc/free events in the recorded history
# leading up to the snapshot.
MAX_NUM_OF_MEM_EVENTS_PER_SNAPSHOT: int = 100000

def start_record_memory_history() -> None:
   if not torch.cuda.is_available():
       logger.info("CUDA unavailable. Not recording memory history")
       return

   logger.info("Starting snapshot record_memory_history")
   torch.cuda.memory._record_memory_history(
       max_entries=MAX_NUM_OF_MEM_EVENTS_PER_SNAPSHOT
   )

def stop_record_memory_history() -> None:
   if not torch.cuda.is_available():
       logger.info("CUDA unavailable. Not recording memory history")
       return

   logger.info("Stopping snapshot record_memory_history")
   torch.cuda.memory._record_memory_history(enabled=None)

def export_memory_snapshot() -> None:
   if not torch.cuda.is_available():
       logger.info("CUDA unavailable. Not exporting memory snapshot")
       return

   # Prefix for file names.
   host_name = socket.gethostname()
   timestamp = datetime.now().strftime(TIME_FORMAT_STR)
   file_prefix = f"{host_name}_{timestamp}"

   try:
       logger.info(f"Saving snapshot to local file: {file_prefix}.pickle")
       torch.cuda.memory._dump_snapshot(f"{file_prefix}.pickle")
   except Exception as e:
       logger.error(f"Failed to capture memory snapshot {e}")
       return

# Simple Resnet50 example to demonstrate how to capture memory visuals.
def run_resnet50(num_iters=5, device="cuda:0"):
   model = models.resnet50().to(device=device)
   inputs = torch.randn(1, 3, 224, 224, device=device)
   labels = torch.rand_like(model(inputs))
   optimizer = torch.optim.SGD(model.parameters(), lr=1e-2, momentum=0.9)
   loss_fn = torch.nn.CrossEntropyLoss()

   # Start recording memory snapshot history
   start_record_memory_history()

   for _ in range(num_iters):
       pred = model(inputs)
       loss_fn(pred, labels).backward()
       optimizer.step()
       optimizer.zero_grad(set_to_none=True)

   # Create the memory snapshot file
   export_memory_snapshot()

   # Stop recording memory snapshot history
   stop_record_memory_history()

if __name__ == "__main__":
    # Run the resnet50 model
    run_resnet50()
附录 B - ResNet50 内存分析器代码示例
# (c) Meta Platforms, Inc. and affiliates.
import logging
import socket
from datetime import datetime, timedelta

import torch

from torch.autograd.profiler import record_function
from torchvision import models

logging.basicConfig(
   format="%(levelname)s:%(asctime)s %(message)s",
   level=logging.INFO,
   datefmt="%Y-%m-%d %H:%M:%S",
)
logger: logging.Logger = logging.getLogger(__name__)
logger.setLevel(level=logging.INFO)

TIME_FORMAT_STR: str = "%b_%d_%H_%M_%S"

def trace_handler(prof: torch.profiler.profile):
   # Prefix for file names.
   host_name = socket.gethostname()
   timestamp = datetime.now().strftime(TIME_FORMAT_STR)
   file_prefix = f"{host_name}_{timestamp}"

   # Construct the trace file.
   prof.export_chrome_trace(f"{file_prefix}.json.gz")

   # Construct the memory timeline file.
   prof.export_memory_timeline(f"{file_prefix}.html", device="cuda:0")

def run_resnet50(num_iters=5, device="cuda:0"):
   model = models.resnet50().to(device=device)
   inputs = torch.randn(1, 3, 224, 224, device=device)
   labels = torch.rand_like(model(inputs))
   optimizer = torch.optim.SGD(model.parameters(), lr=1e-2, momentum=0.9)
   loss_fn = torch.nn.CrossEntropyLoss()

   with torch.profiler.profile(
       activities=[
           torch.profiler.ProfilerActivity.CPU,
           torch.profiler.ProfilerActivity.CUDA,
       ],
       schedule=torch.profiler.schedule(wait=0, warmup=0, active=6, repeat=1),
       record_shapes=True,
       profile_memory=True,
       with_stack=True,
       on_trace_ready=trace_handler,
   ) as prof:
       for _ in range(num_iters):
           prof.step()
           with record_function("## forward ##"):
               pred = model(inputs)

           with record_function("## backward ##"):
               loss_fn(pred, labels).backward()

           with record_function("## optimizer ##"):
               optimizer.step()
               optimizer.zero_grad(set_to_none=True)

if __name__ == "__main__":
    # Warm up
    run_resnet50()
    # Run the resnet50 model
    run_resnet50()