torch.meshgrid
- torch.meshgrid(*tensors, indexing=None)[source][source]
根据 attr:tensors 中的 1D 输入创建坐标网格。
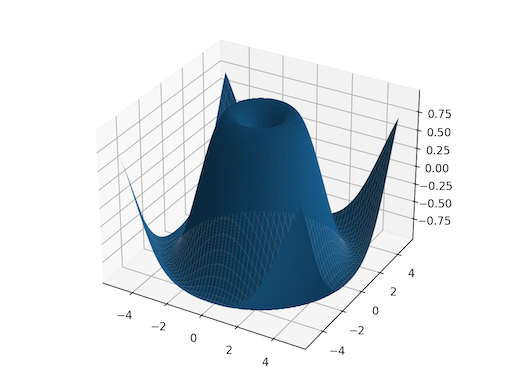
这有助于您在某个输入范围内可视化数据。下面是一个绘图示例。
给定 1D 张量 及其对应的大小 ,这将创建 N 维张量 ,每个张量的形状为 ,输出 通过将 扩展到结果形状来构建。注意
0D 输入与单个元素的 1D 输入等效处理。
警告
torch.meshgrid(*tensors) 当前行为与调用 numpy.meshgrid(*arrays, indexing='ij') 相同。
未来 torch.meshgrid 将过渡到默认的 indexing='xy'。
https://github.com/pytorch/pytorch/issues/50276 跟踪此问题,旨在迁移到 NumPy 的行为。
参见
torch.cartesian_prod()具有相同的效果,但它将数据收集到向量的张量中。- 参数:
张量(Tensor 列表)- 标量或一维张量的列表。标量将被自动视为大小为 的张量。
索引(可选[str])-
(str, 可选): 索引模式,可以是“xy”或“ij”,默认为“ij”。有关未来更改的警告请参阅说明。如果选择“xy”,则第一个维度对应第二个输入的基数,第二个维度对应第一个输入的基数。
如果选择“ij”,则维度顺序与输入的基数相同。
- 返回值:
如果输入有 个大小为 的张量,则输出也将有 个张量,其中每个张量的形状为 。
- 返回类型:
张量序列
示例:
>>> x = torch.tensor([1, 2, 3])
>>> y = torch.tensor([4, 5, 6])

Observe the element-wise pairings across the grid, (1, 4),
(1, 5), ..., (3, 6). This is the same thing as the
cartesian product.
>>> grid_x, grid_y = torch.meshgrid(x, y, indexing='ij')
>>> grid_x
tensor([[1, 1, 1],
        [2, 2, 2],
        [3, 3, 3]])
>>> grid_y
tensor([[4, 5, 6],
        [4, 5, 6],
        [4, 5, 6]])

This correspondence can be seen when these grids are
stacked properly.
>>> torch.equal(torch.cat(tuple(torch.dstack([grid_x, grid_y]))),
...             torch.cartesian_prod(x, y))
True

`torch.meshgrid` is commonly used to produce a grid for
plotting.
>>> import matplotlib.pyplot as plt
>>> xs = torch.linspace(-5, 5, steps=100)
>>> ys = torch.linspace(-5, 5, steps=100)
>>> x, y = torch.meshgrid(xs, ys, indexing='xy')
>>> z = torch.sin(torch.sqrt(x * x + y * y))
>>> ax = plt.axes(projection='3d')
>>> ax.plot_surface(x.numpy(), y.numpy(), z.numpy())
>>> plt.show()